ngrapher is a simple tool to create realtime colored ncurses graphs from numerical data. You can download version 0.2.0 as debian packages here:
Source repository can be found in the Repository page, source packages in the Downloads page.
Examples
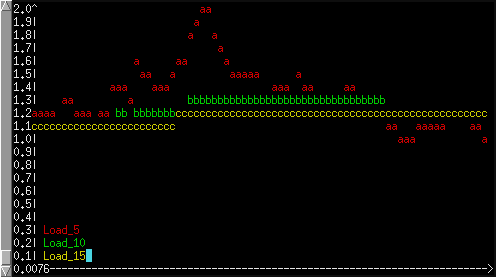
To display load average of the system, we can use the following command:
$ (while true ; do sed -e 's/\(.* .* .*\) .* .*/\1/' < /proc/loadavg ; sleep 5;done) \
   | ngrapher
It prints three values every five seconds, and as they are piped into ngrapher, you see this beautiful plot:
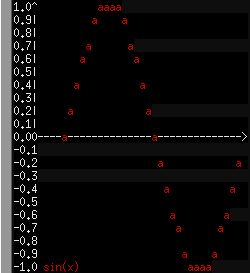
You can also graph csv files:
$ ngrapher < sin.csv
Get it
Download sources from git repository:
$ git clone http://piggledy.org/projects/ngrapher/ngrapher.git/
Then, compile it:
$ cmake .
$ make
You can now play with this tool, for example with random data:
$ ./input.py | ./ngrapher